Observability with eBPF and OTel
Background
Imagine maintaining multiple services, either monolith or microservices. Sometimes they communicate with each other, sometimes they don't. But do you know how they communicate with each other? You could dive into the source code, but then you have to cross-check it with actual network requests 😶.
Then there are logs and metrics, and without proper grouping it's going to be a mess when you are debugging a prod issue and you have to submit multiple queries for different things across all services to get the full picture of the offending requests.
OpenTelemetry (OTel) is the solution
Essentially it's a mechanism in which you can extract traces, logs and metrics from your services into a data sink.
A trace tells what communicates with what. Can involve multiple hops.
Logs are self-explanatory. Metrics are numerical values, something like requests per second or message size.
Logs and metrics can have a trace id attached, which makes it easier for operators to query and filter relevant observability data when debugging issues.
But then someone has to set all this up. They have to dive into the source code, and sprinkle OTel stuff to make the service emits traces, logs and metrics. And this is a lot of work. And it's even more fun if you have to track a trace originating from serviceA, which talks to serviceB, and forwarded to serviceC. You'll have to make sure that when the OTel data traverses through the call chain, they retain the same trace id.
And if you have a lot of microservices, yup, exactly what you are thinking. You'll have to sprinkle OTel code in all of them.
What if you don't want to change your code
Luckily there's eBPF. Basically it allows you to read stuff from the linux kernel space, and there happens to be a lot of data there, all juicy stuff for observability. For example, you can setup Grafana Beyla which can automatically extract traces. This is known as auto-instrumentation, where you setup the necessary infrastructure to obtain observability data without changing a single line of code. Observability vendors utilize eBPF to achieve auto-instrumentation, that's why their docs only tell you to install an agent on the host OS and it's done.
eBPF is linux only, which might be an issue if you are using other OSes for testing observability when you are developing locally. But you can always spin up a small linux vm for this.
But there's no reason to not use OTel and eBPF together
They are not mutually exclusive. Using one does not exclude you from using the other. Which means you can use eBPF to collect generic info, and when you want to be specific or fine-grained data you instrument your code manually via OTel.
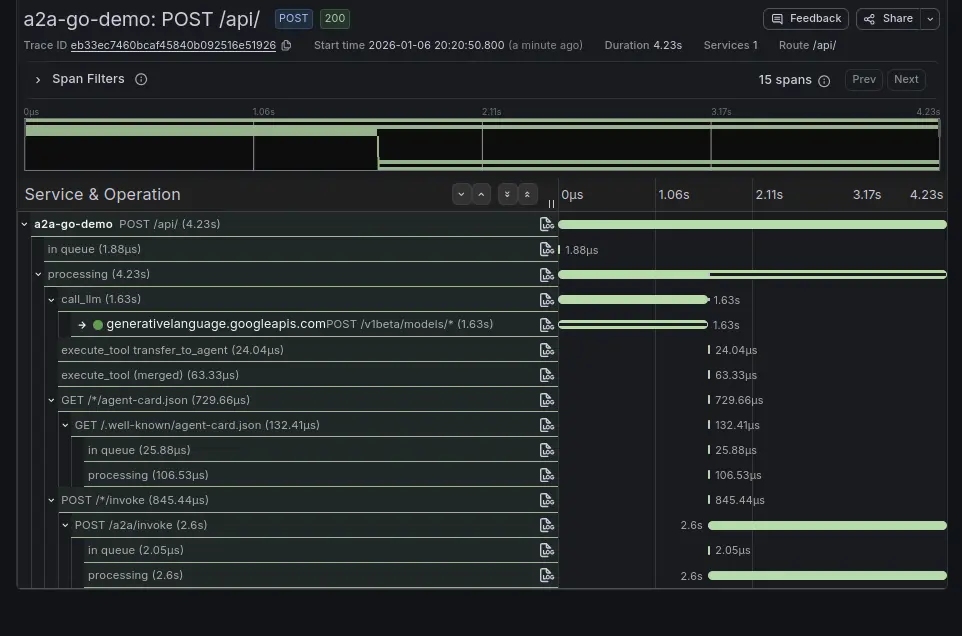
See a2a-go-demo for example OTel + eBPF implementation.
This is from eBPF, you can see the trace for a single api call.
And a library in this project already emits OTel, which means I only need to forward it to OTel endpoint.
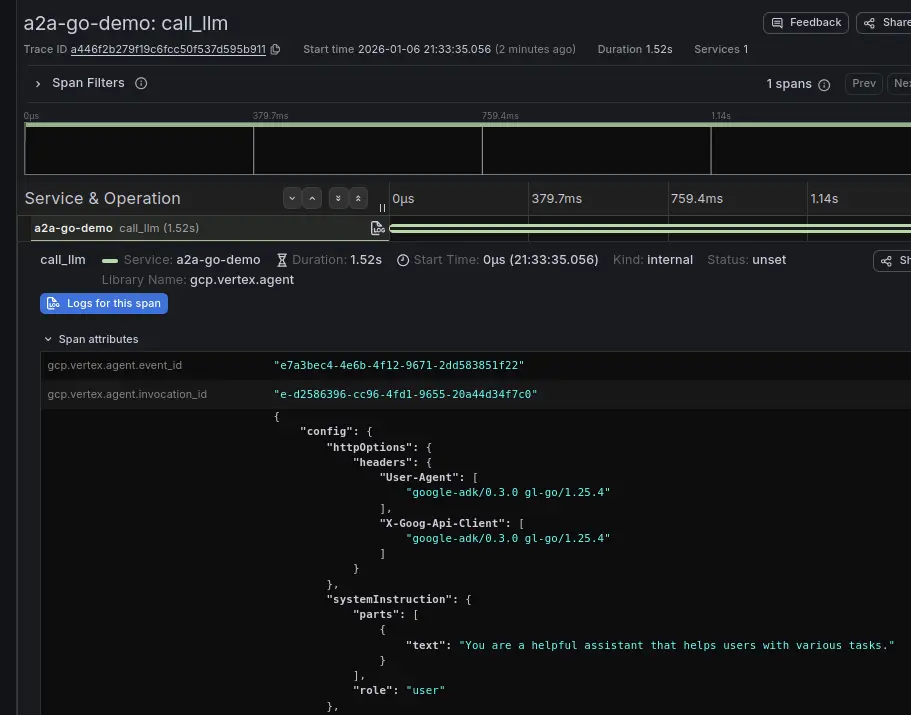
These cover a lot of info already, and when you want to zoom in to extract finer-grained data, you can always instrument manually.
Happy o11y!