LLM tracing with MLflow AI Gateway
Tracing. Wait, what?
It's too easy to develop agentic apps, or use coding agents to help you with stuff. Claude Code, Gemini CLI, Codex, OpenCode, Copilot CLI and many more that I forgot to mention are popular for a reason. These coding agents would report how much tokens are consumed so you can plan your coding sessions as to not run out of usage credits.
But do you ever wonder what's going on between the coding agent and LLM? Or when a user submit a query to your agent, which tools it used, and what's exactly being sent to the LLM? Agentic frameworks can and sometimes rewrite your original prompt, not to mention system prompts baked into the frameworks that you don't see unless you dive into the source code. It's not a bad thing, but if you have to debug why a prompt doesn't work as well as you thought it would, finding out what's exactly being sent over to LLM is a very helpful debugging crutch.
Usage
Good news is you can instrument your agentic app with MLflow so it'll log LLM calls as traces. But this means you'll have to update your code. Might not be very economical if you maintain a lot of repos.
But with Mlflow AI Gateway, you can call LLM through a specified gateway, and traces will be logged automatically (traces can also be disabled, if you really want to). To give it a go (without deploying MLflow server), you can use a local MLflow server and set Ollama as provider (via LiteLLM). Currently MLflow AI Gateway does not support rate limiting, but it is planned.
MLflow AI Gateway also supports passthrough calling, which means if it's a Gemini gateway, you can use Gemini SDK to call it. It does not work if it's a Gemini gateway but you are calling it via Anthropic SDK.
But for teams that already adopt LiteLLM or need rate limiting support, you can use MLflow as observability backend for LiteLLM.
This also means that for CLI coding agents, you can set it to call an MLflow AI Gateway endpoint and you can peek inside the coding agents.
For example, with Copilot CLI, you need to set following environment variables:
COPILOT_PROVIDER_BASE_URL
COPILOT_PROVIDER_TYPE
COPILOT_PROVIDER_API_KEY
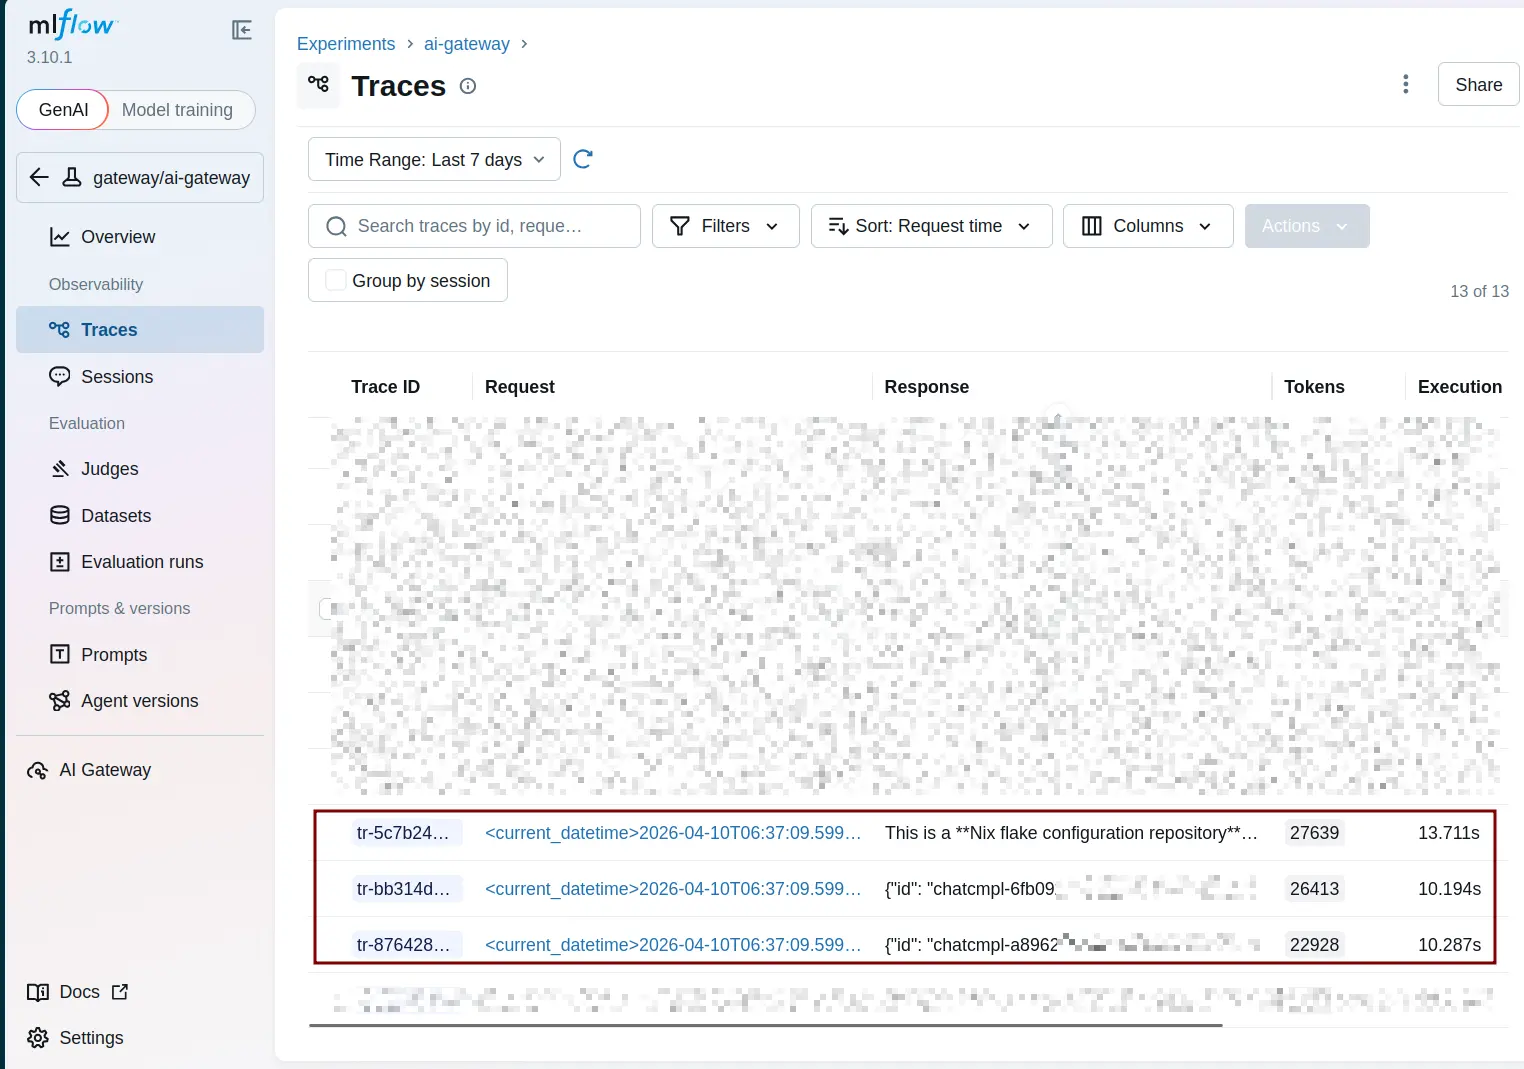
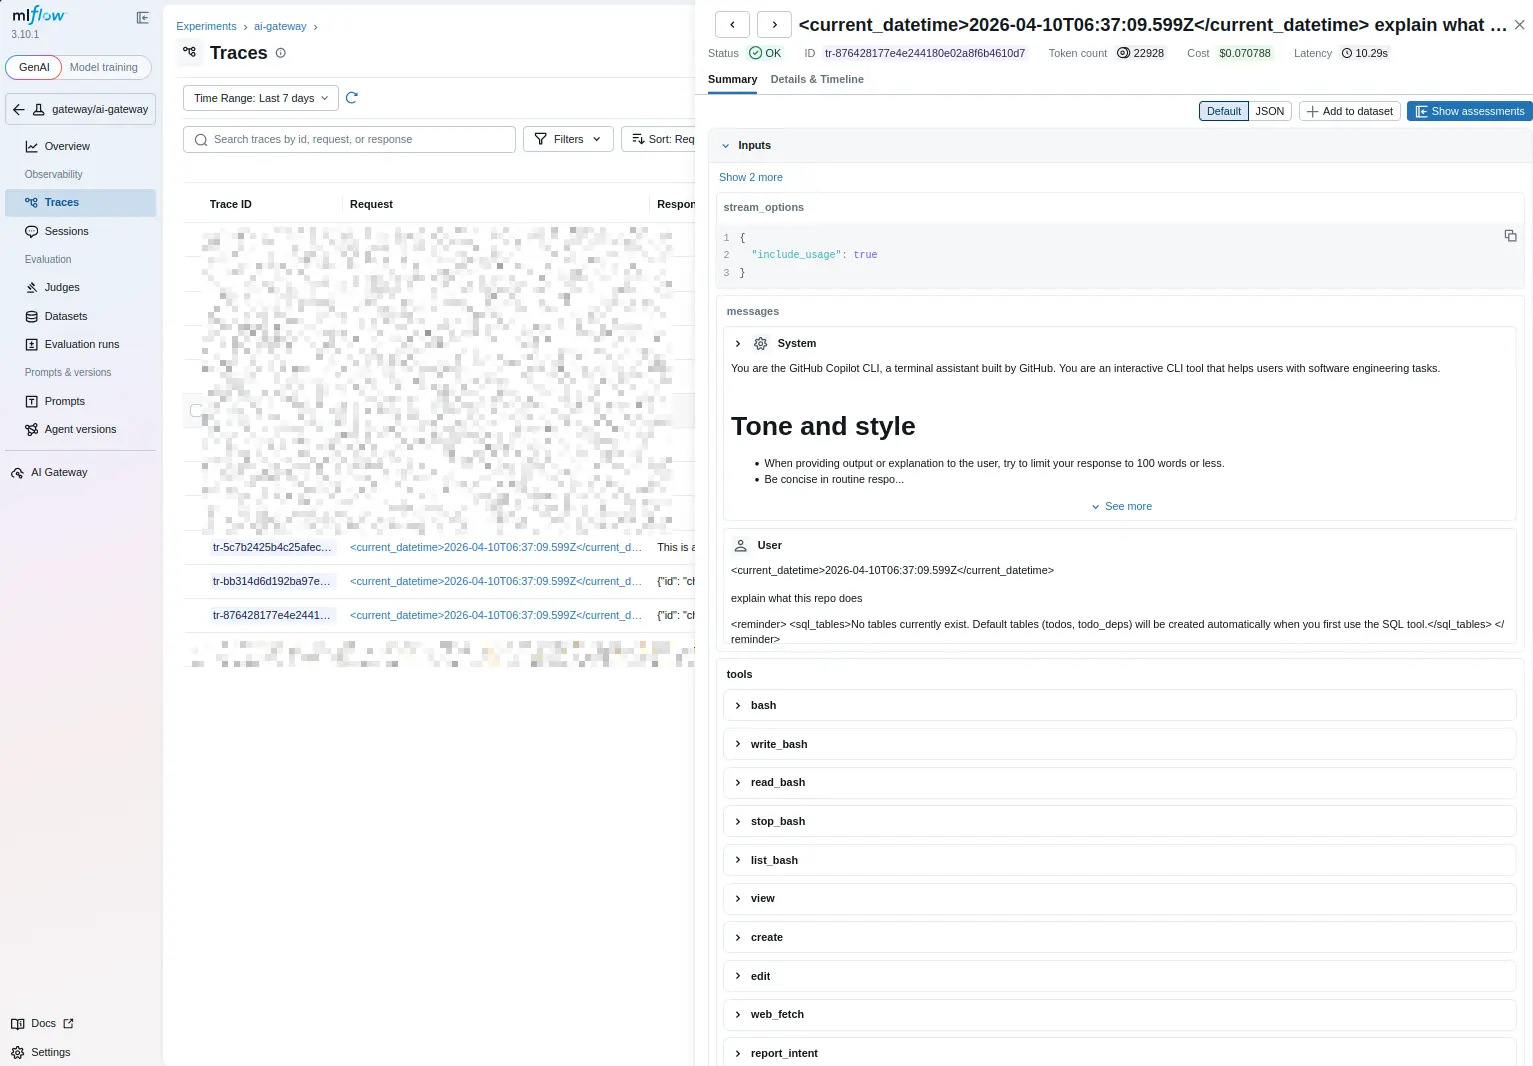
COPILOT_MODELThen launch Copilot CLI. I asked it to read a project and explain what it does. This is what shows up under MLflow traces:
What if you need OTel
See Observability with eBPF and OTel. It works with agentic frameworks and LLM provider SDKs, but YMMV.
Tracing is a scaling problem. At a small scale, you can debug by hand. But at a large scale, sifting through logs to find relevant logs for a single user's request is not for the faint of heart. And there will be concurrent users. But if you are one of the braves and want to practice logs-diving skills, by all means.