Coroot revisited
Coroot has come a long way since 2023. Now it uses ClickHouse as storage backend, in addition to Prometheus (though you can also set Coroot to store metrics in ClickHouse).
Service runtimes are displayed in applications list, which makes it easier to identify services at a glance. Applications are grouped in application, control-plane and monitoring, which is useful when you want to filter out stuff during a debugging session.
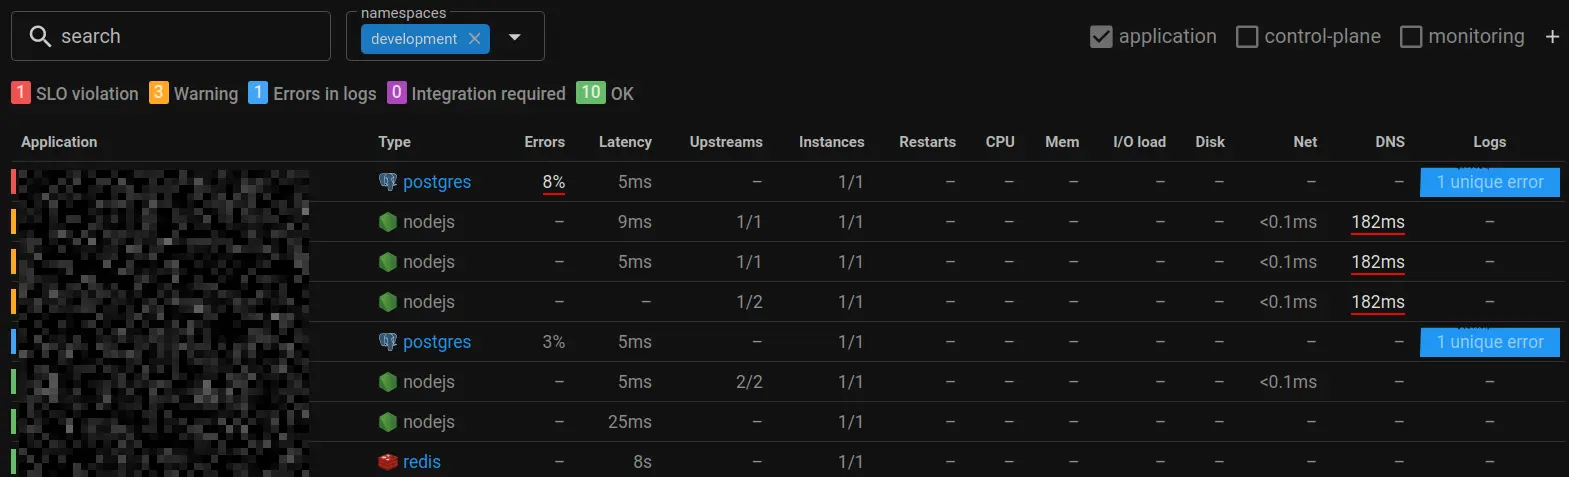
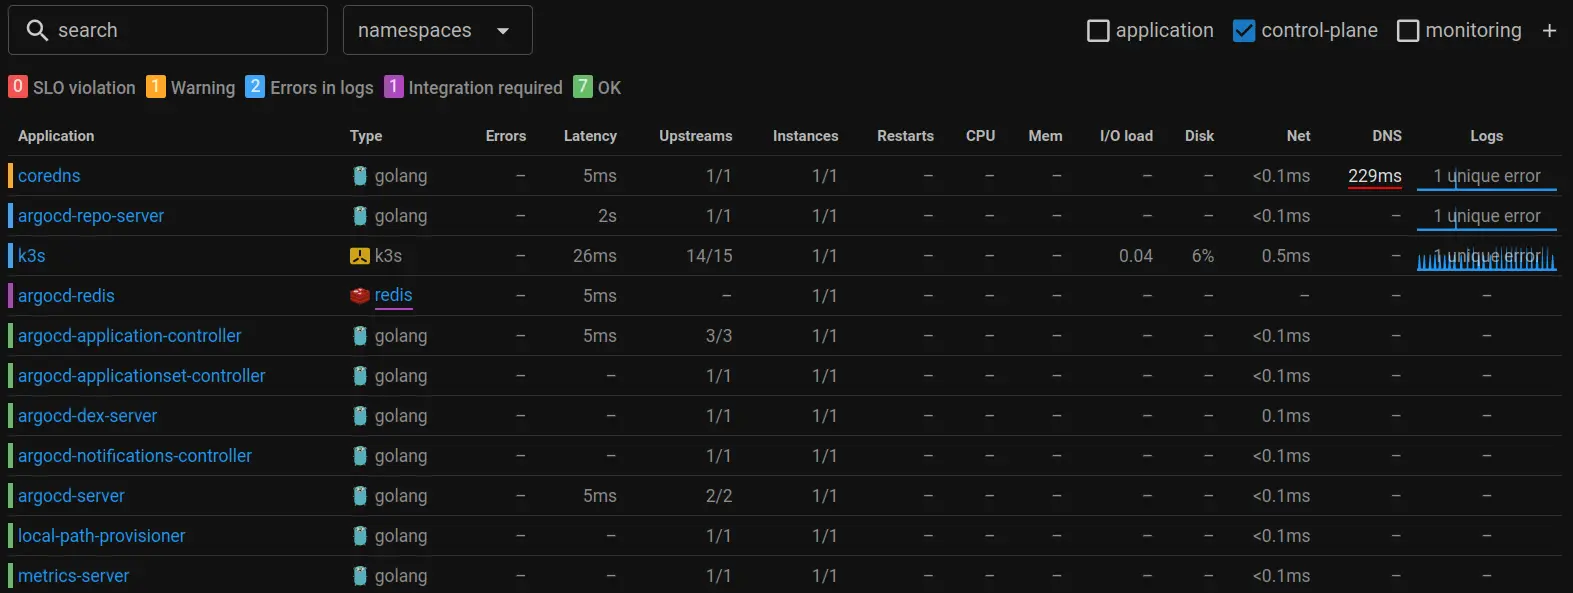
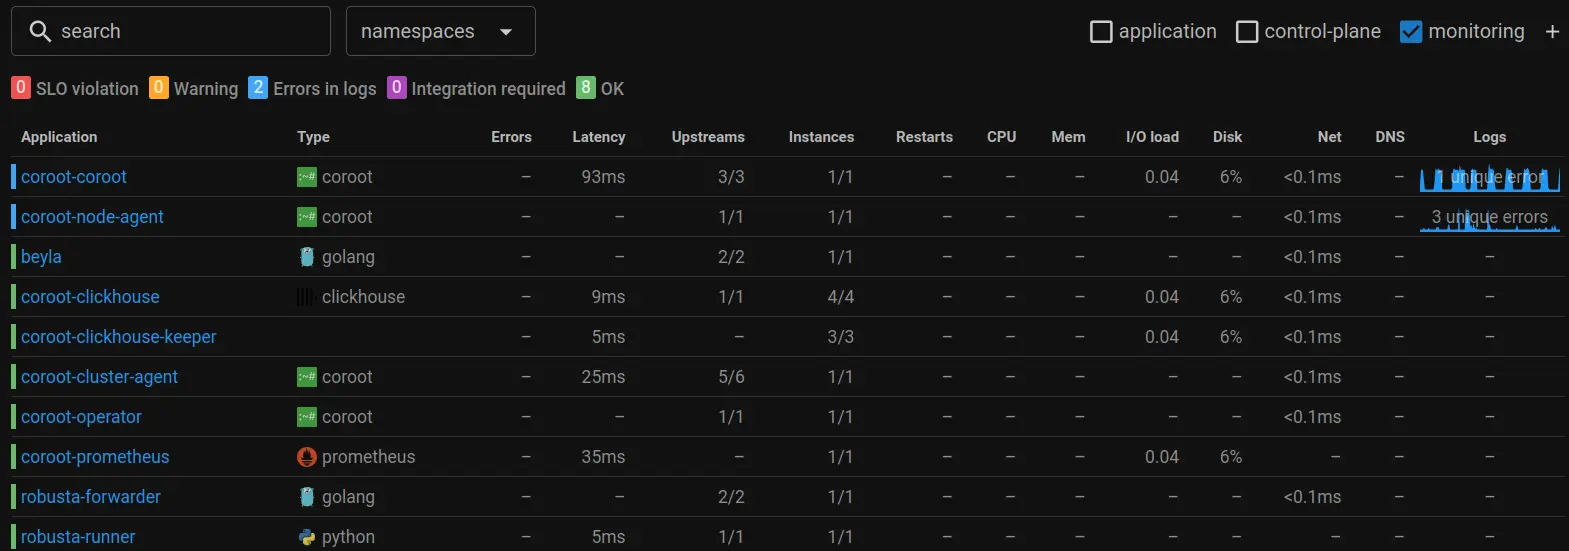
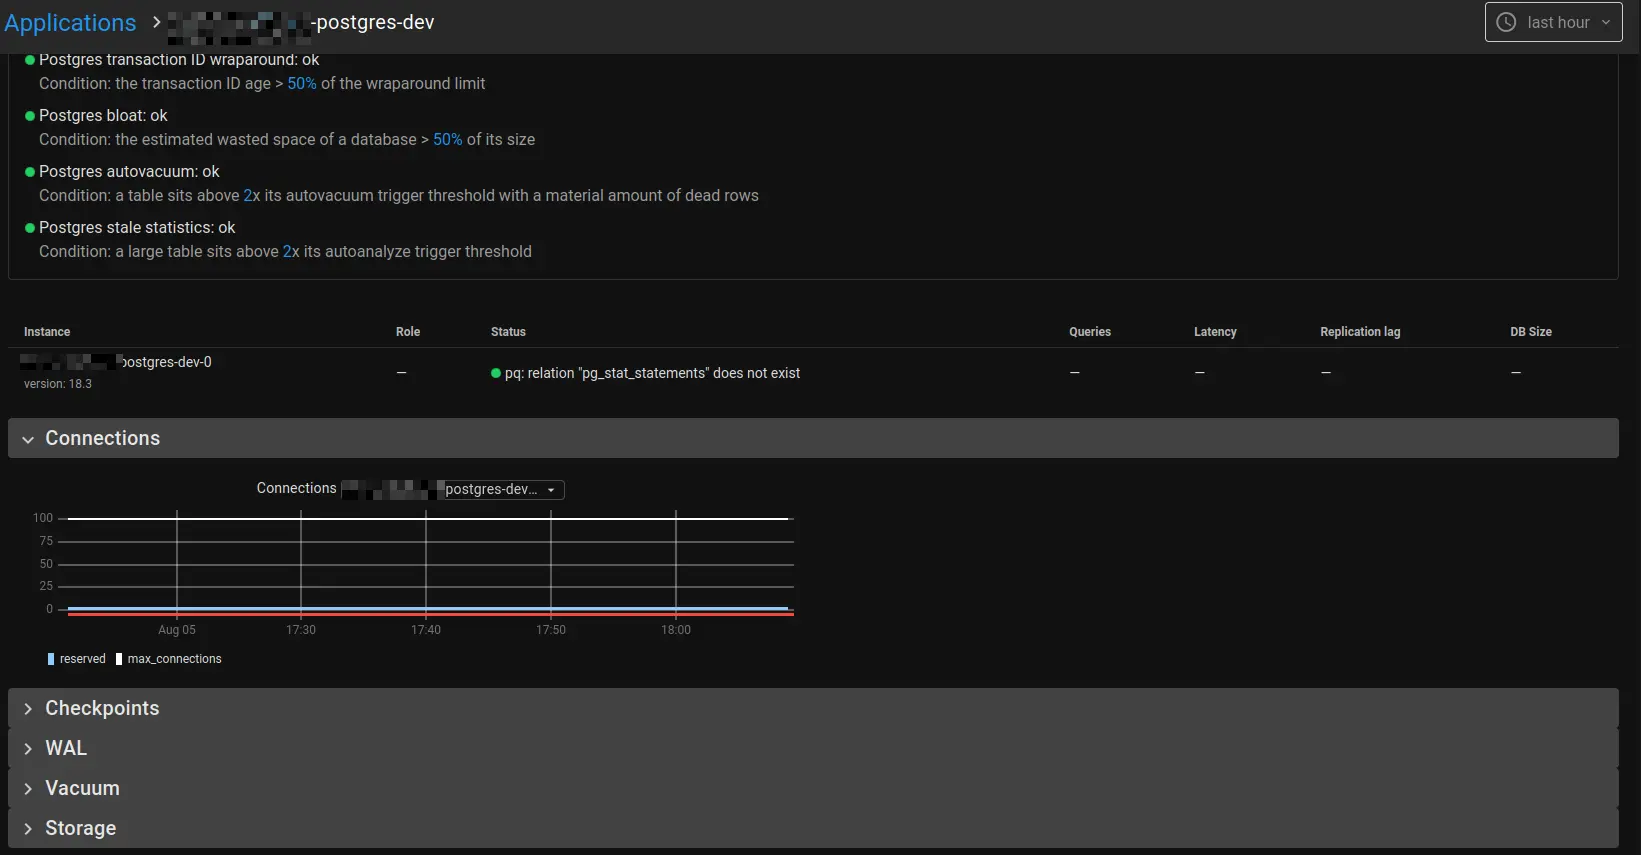
Peeking into postgres/redis is now also possible. Standard database metrics like current connections, WAL, storage are available. But this requires supplying postgres username and password, which you can do manually via the web ui, or via k8s annotations. Other generic eBPF metrics are available out of the box.
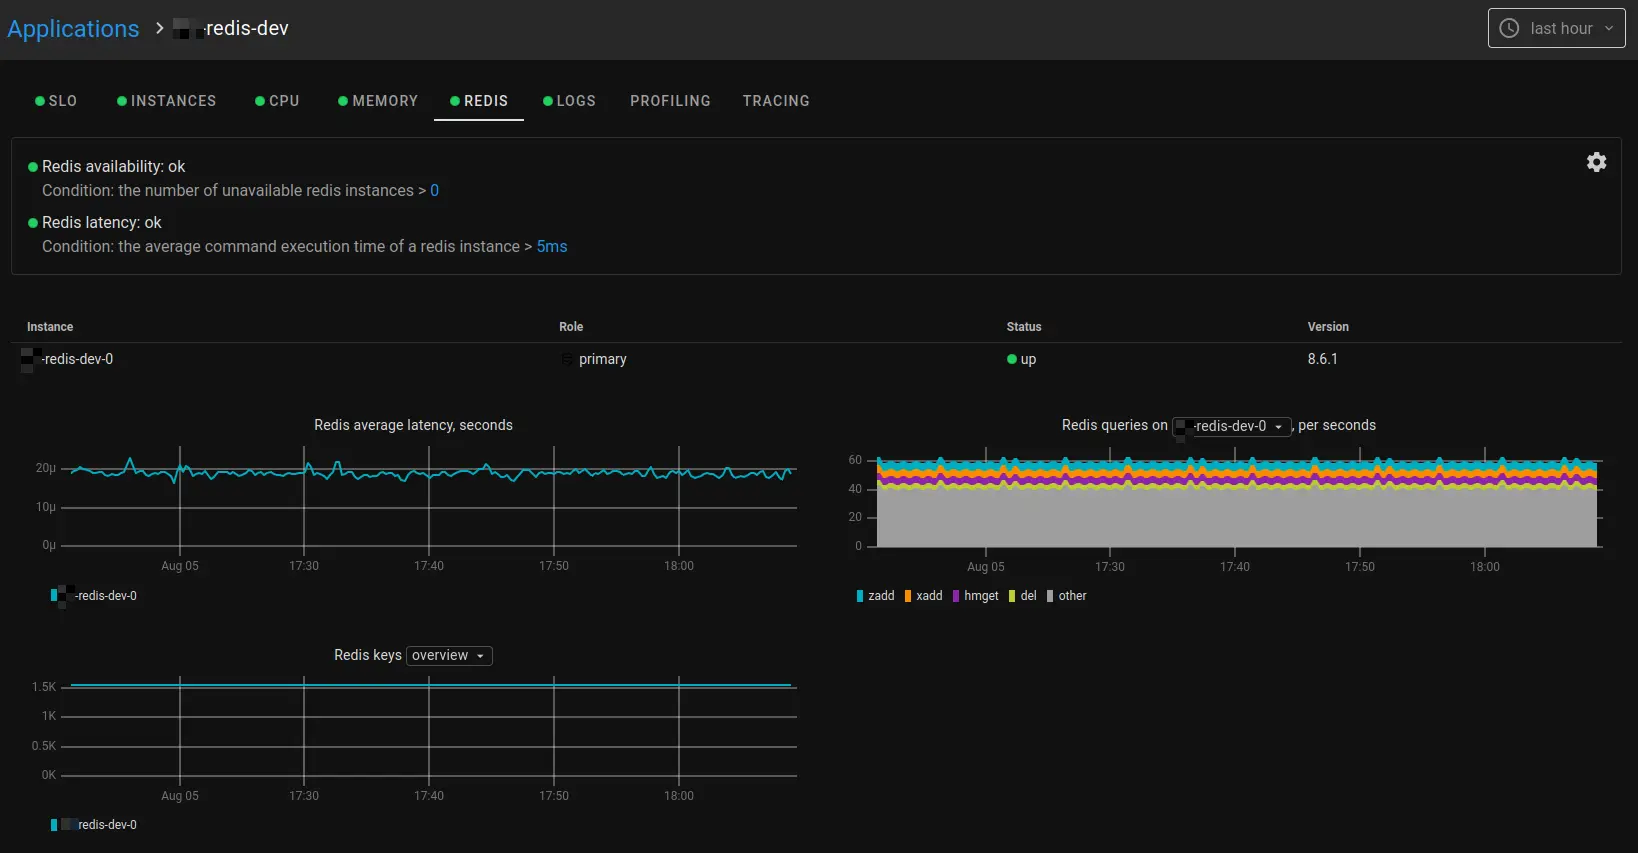
For redis, in order to see average latency, queries per second and redis keys, you'll have to point Coroot to target redis instances (but generic eBPF metrics work out of the box).
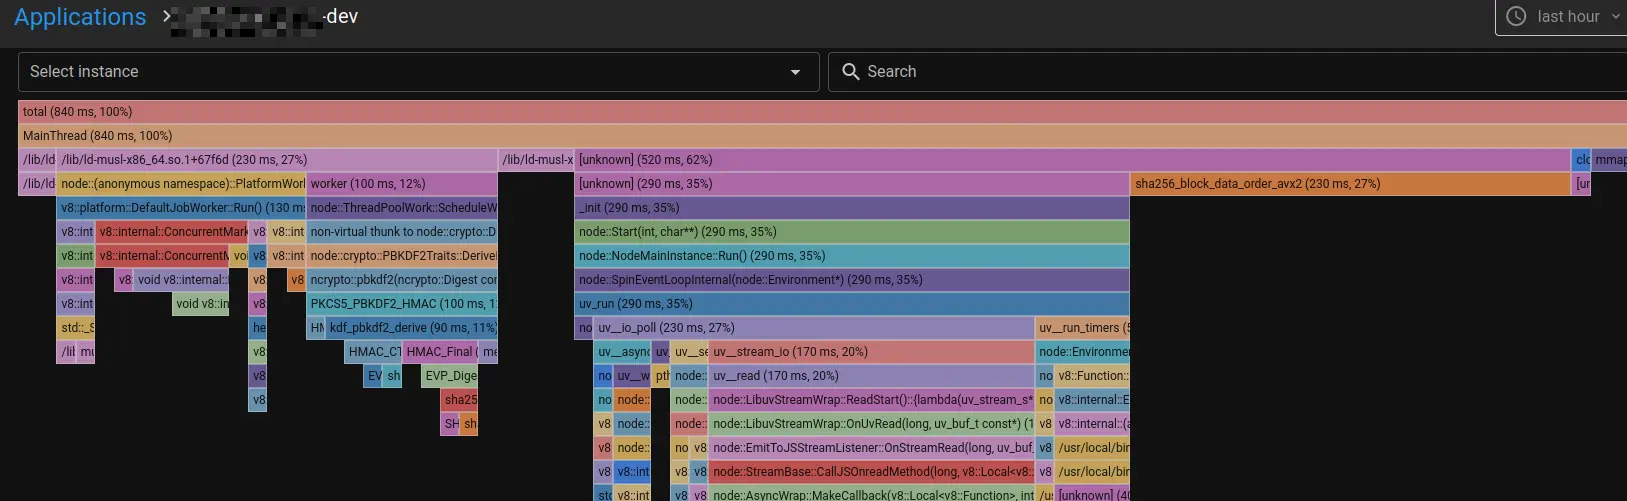
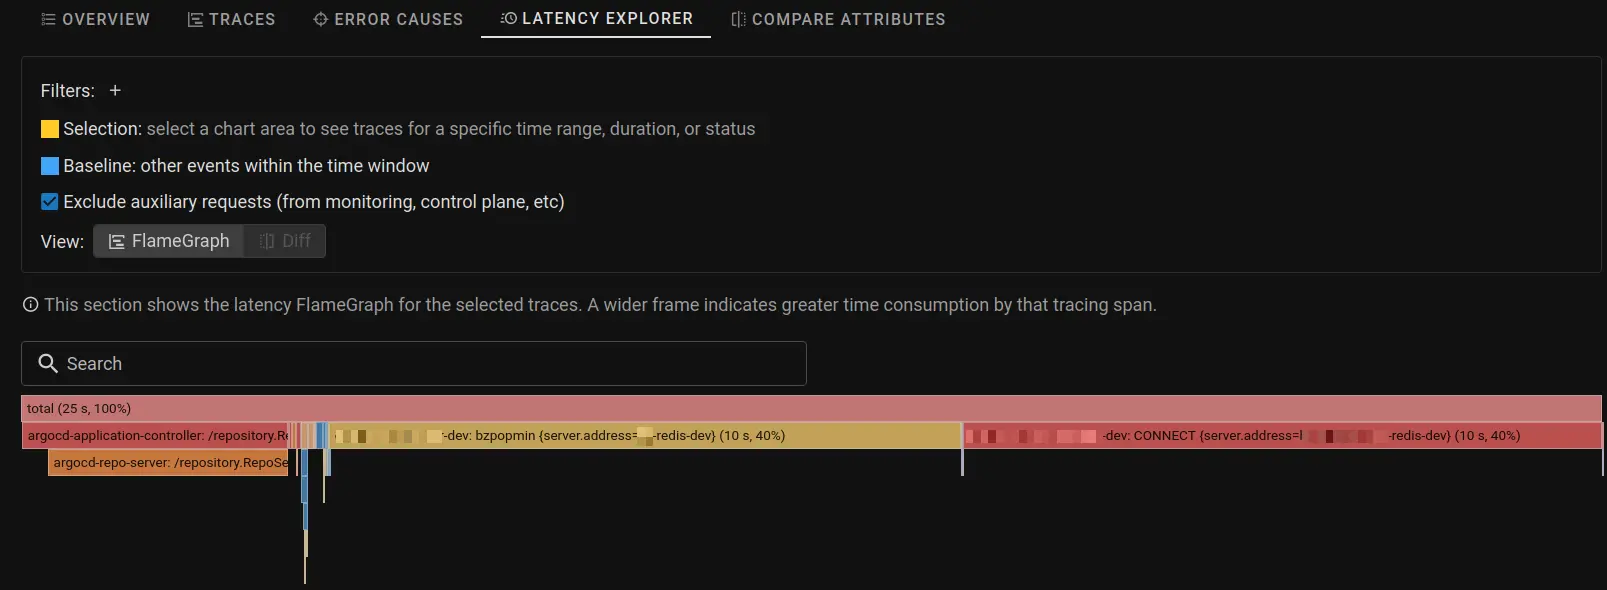
A nice addition is baked-in flamegraphs. Normally you'll have to setup manual instrumentation and run your workloads to see a framegraph, which is easy when you have a few services, but would be very tricky to do this in production when you have multiple services working together. With Coroot, you do not have to configure anything (aside from setting up Coroot on your k8s cluster).
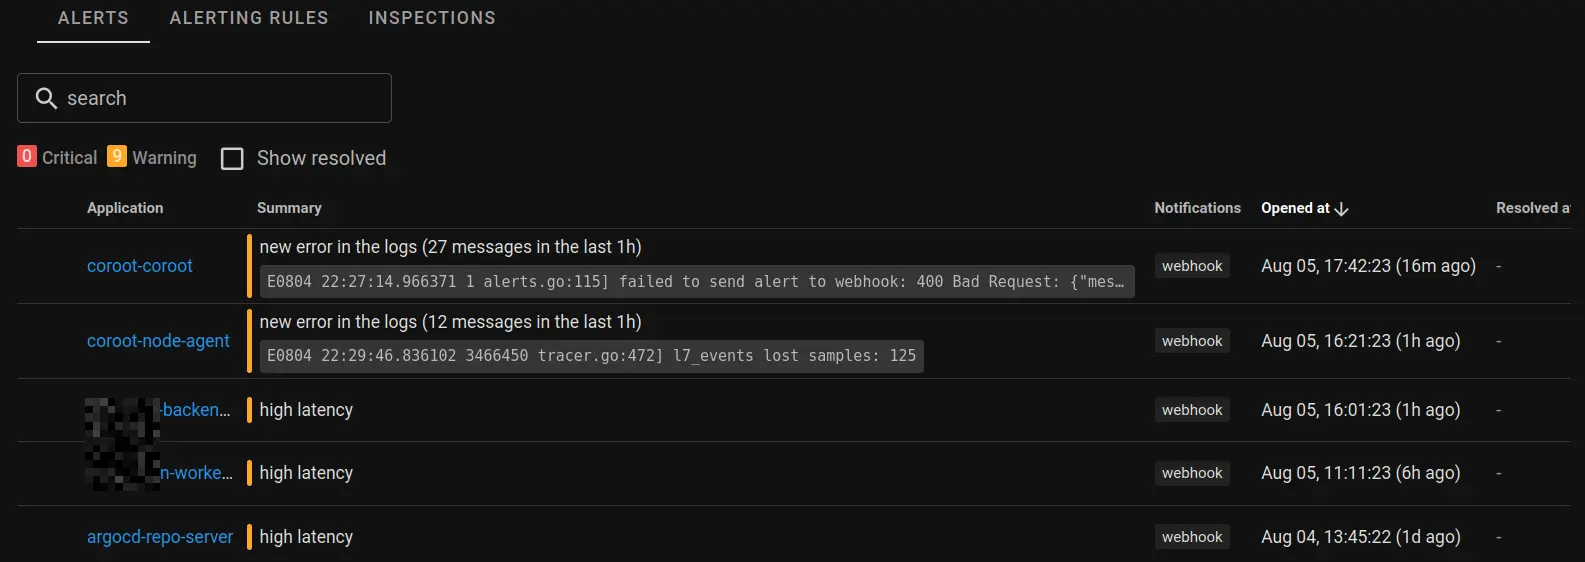
But when something is off, alerts would be nice. What's not nice is having to configure alerts by hand (you'll miss some of them, but hopefully you'll realize before you need them). Coroot has built-in alerting rules, and you can supply a webhook to send you alerts.
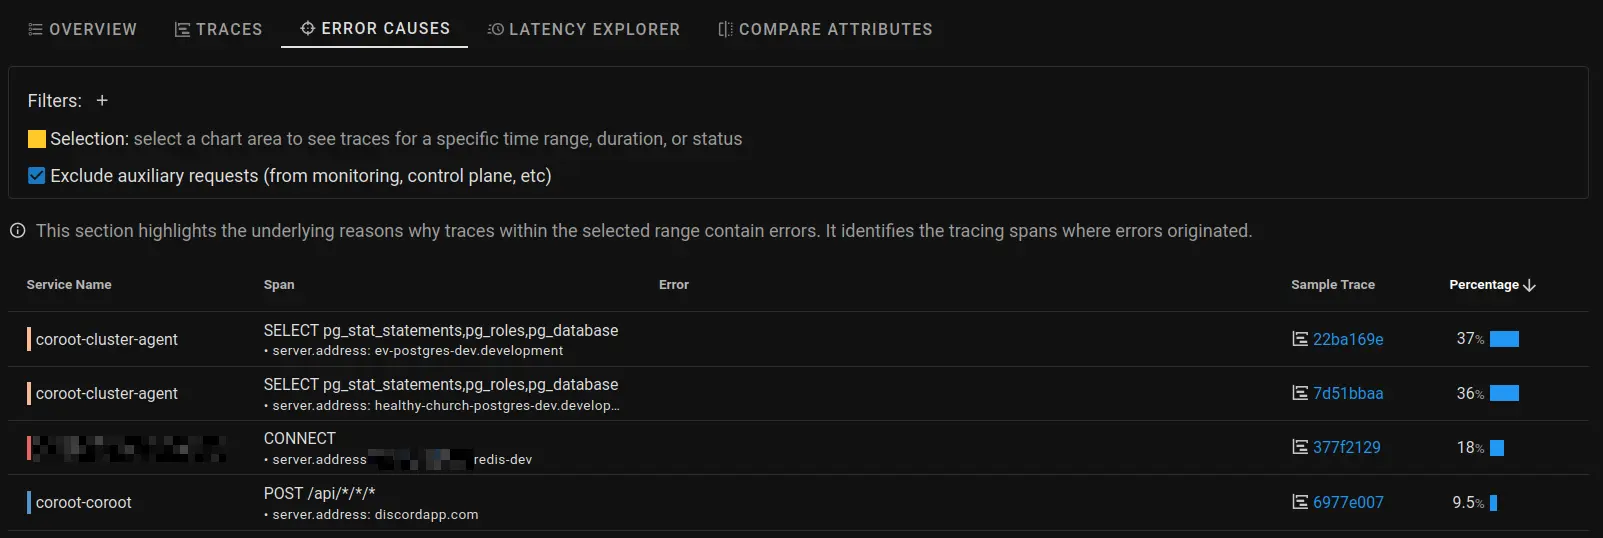
Traces are a lifesaver when you have to debug interconnected services. Sometimes you are hunting for an error somewhere between the call chains, sometimes you want to shave off 100ms latency here and there. The updated ui makes it easier to look for these information.
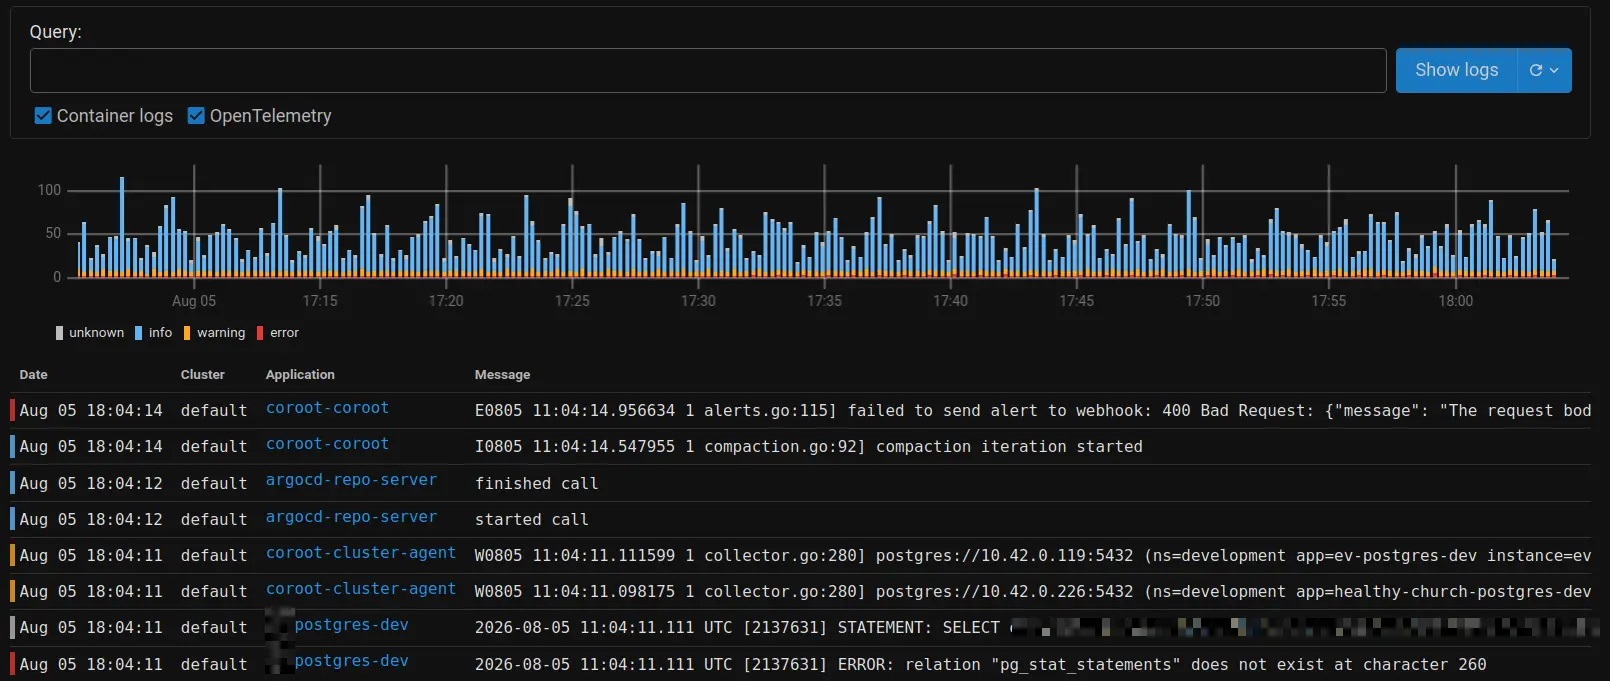
Especially with logs, you know something is really off when you have high ERROR rates. The nice thing is you can filter between container and OTel logs.
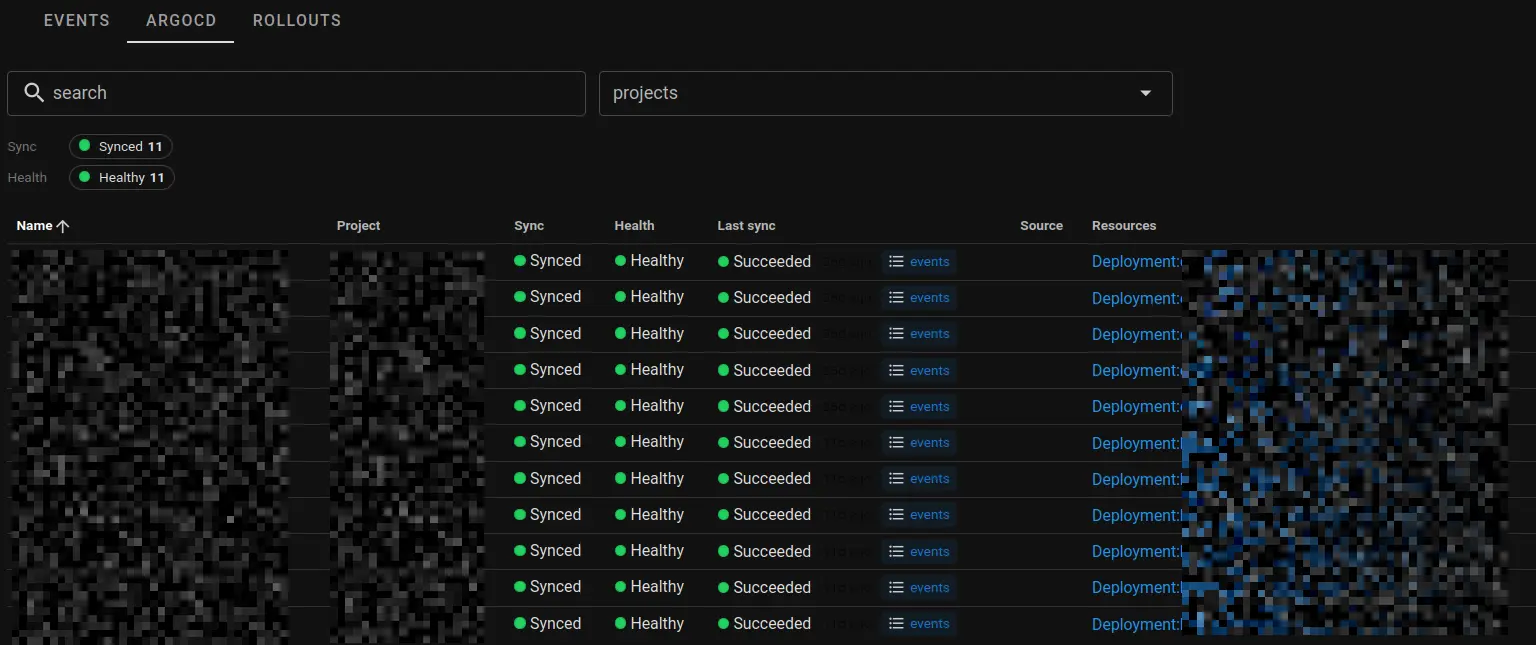
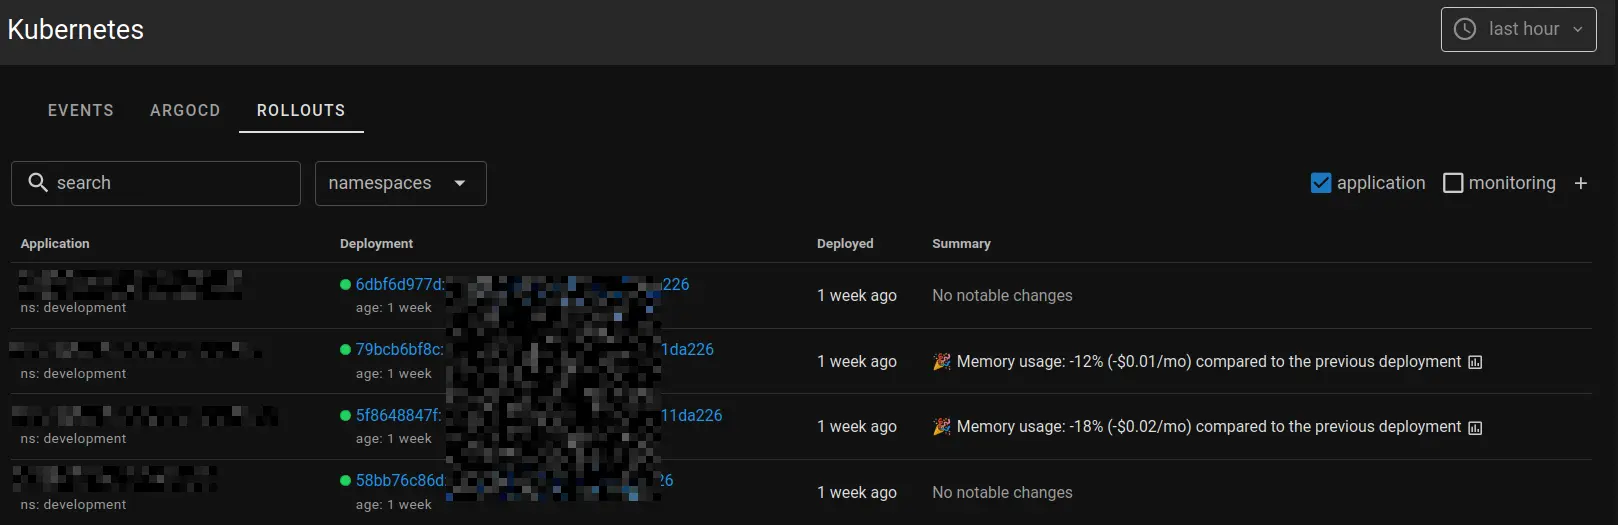
Less control plane dashboards to check is good. Now you can see ArgoCD deployments from Coroot. It also displays latest rollouts (and it would be sent through webhook notifications as well).
Usually you'll need to set up OpenCost for FinOps, and you really should use this since it has very extensive coverage.
But if you only need cost estimation based on CPU / memory, Coroot would be good enough.
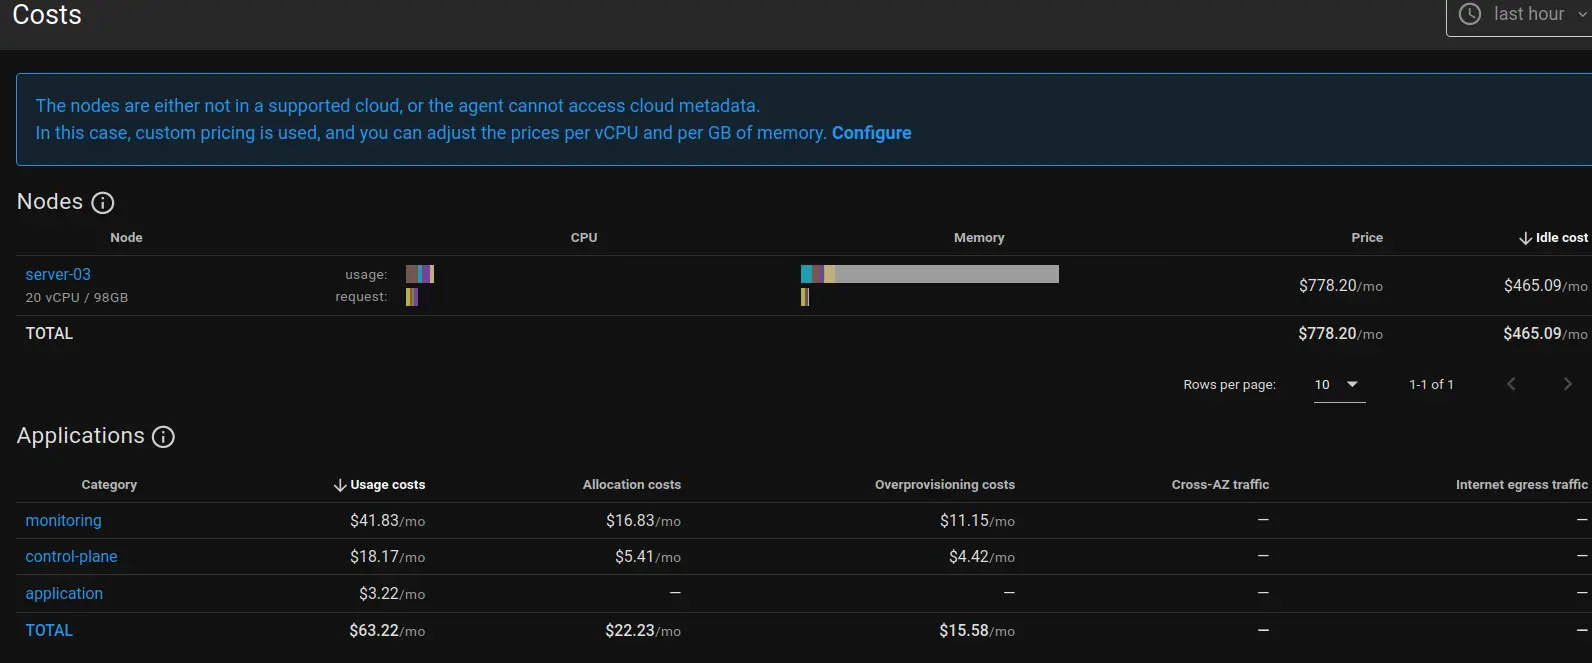
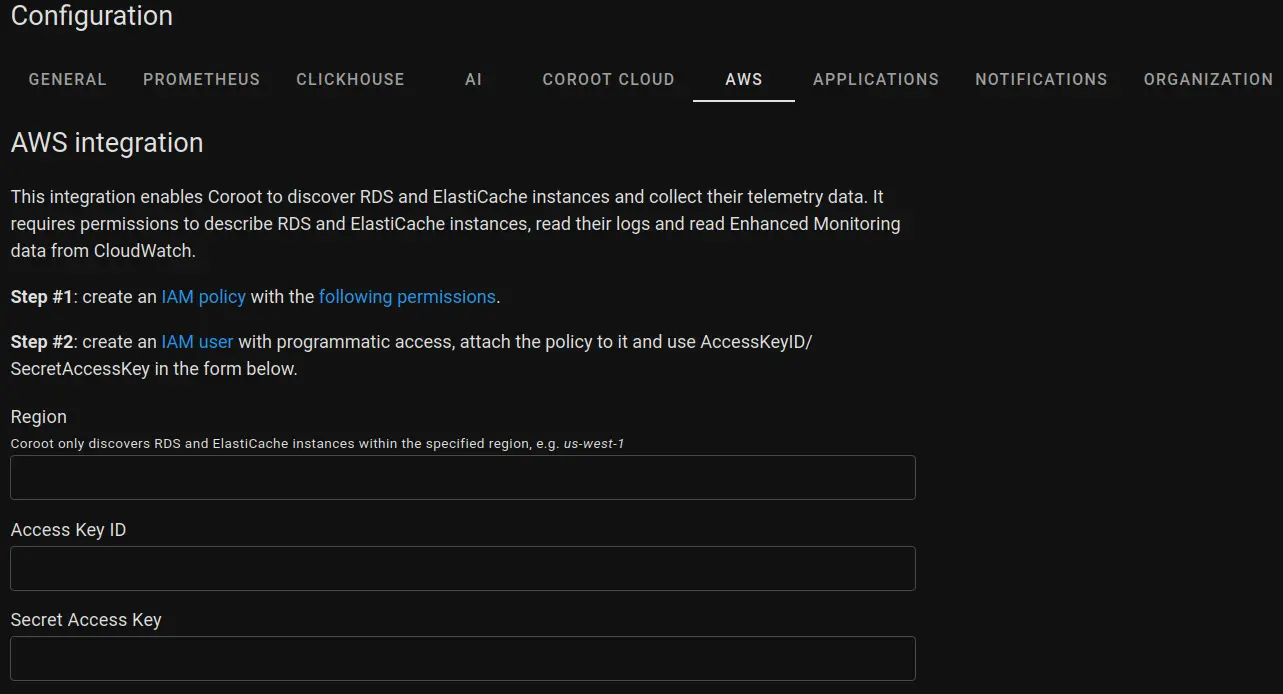
If you're on AWS, Coroot can also fetch costs for RDS and ElastiCache (EKS support is planned).
What's really nice about Coroot is you get almost all the features out of the box, and you don't need to stitch multiple components together manually. You can use something else to scrape OTel traces to Coroot, but then it's only a single service. Less components to upgrade and maintain, sign me up.